.svg)


Accurately measuring virtual event success requires uniform metrics and reliable data. They track the performance of each part of the webinar experience, from brand exposure and networking opportunities to post-event engagement.
The ultimate metric for any marketing endeavor is ROI (i.e., profit, whether monetary or something else). Maximizing this indicator necessitates optimizing the other metrics that contribute to a healthy profit.
In this guide, we’ll go over key virtual event success metrics, how to track and analyze them, and how to incorporate that data into future events for more lucrative results from your sessions.

Why It’s Crucial to Measure Virtual Event Success
Monitoring your virtual event’s results lays a solid foundation for decision-making. If you alter your webinar’s engagement features, for instance, measuring the change in engagement that resulted will tell you whether to keep the new addition, go back to your original plan, or try another approach.
Success metrics ground all of your decisions in data, covering your event marketing through the overall experience with your online events.
Virtual Event KPIs vs. Virtual Event Success Metrics
Virtual event KPIs and success metrics are both important, distinct elements. Although often used interchangeably, they serve different purposes.
Virtual Event KPIs
Key performance indicators are narrower and more quantitative. They’re normally tied to objectives for the virtual event experience. Conversion rate is one example, with others being:
- Number of registrations
- Attendance rate
- Lead generation count
- Revenue
- ROI
- Conversion rate
KPIs compare performance against a specific target. For example, if you have X attendance rate in event #1, marketers may aim for X * 1.05 attendance rate for event #2.
So, KPIs are more specific and quantifiable benchmarks intended to improve future event success.
Virtual Event Success Metrics
In contrast, virtual event success metrics are more qualitative and holistic. They gauge how well an event achieved its goals. Like KPIs, they monitor different stages of the virtual event experience and cover elements such as social media mentions and other online activity surrounding the event. Virtual event success metrics also overlap with KPIs in areas like registration and attendance. They gather qualitative feedback that includes:
- How satisfied event attendees are with the event
- Speaker and organizer satisfaction
- Social media activity numbers and positivity versus negativity
- Lead quality (you can break this down to be more objective)
- Viewer status (returning viewers and average time viewing)
- Online community activity
- Networking relationships created
- Post-event survey participation and responses
- Long-term impact
Virtual event platforms have built-in analytics for most attendee engagement metrics. In combination with a CRM, you can add metrics for marketing strategy success and event results.
For comprehensive performance analysis, let’s delve into some of the major metrics and how to track them.
Read more: Webinars vs. Virtual Events
Registration and Attendance
Registration and attendance counts are basic but important indicators. If your event marketing and event registration landing pages are designed well, they should return high numbers.
Attendance and registration are closely linked to:
- Virtual event promotion on various platforms
- Ad and post headings
- Written copy
- Ad banner and image quality
- Lead nurturing and email marketing
This is why registrations are so important in event planning.
In addition, anyone who registers can become a lead, and even registrants who don’t attend the event should be segmented in your email list and nurtured over time. So, registrations also serve to gauge the level of interest in your business and the topics you cover.
Registration Count Benchmarks
Registration counts between events help you identify which topics interest more people. If the number of registrants earned for any event is lower than average, for instance, that indicates its subject matter is less appealing, or perhaps your virtual event title was too boring or unclear.
Attendance Count Benchmarks
Attendance counts determine the number of attendees you have for your webinars (which is especially important to compare against registration numbers). Your benchmarks give you attainable goals for filling audience seats for all your live events.
Registrations vs. Attendance
The ratio between registrations and attendants is a virtual event KPI that compares the number of people who register for an event and the number who then show up. While the former will almost always be higher than the latter, if there’s a major gap between the two, improvements need to be made.
Audience Engagement
Audience engagement directly impacts conversions, retention, and virtual event ROI. However, given its subjective nature, event organizers are faced with two critical questions:
- How do I engage virtual event audiences from behind their screens?
- How do I measure engagement?
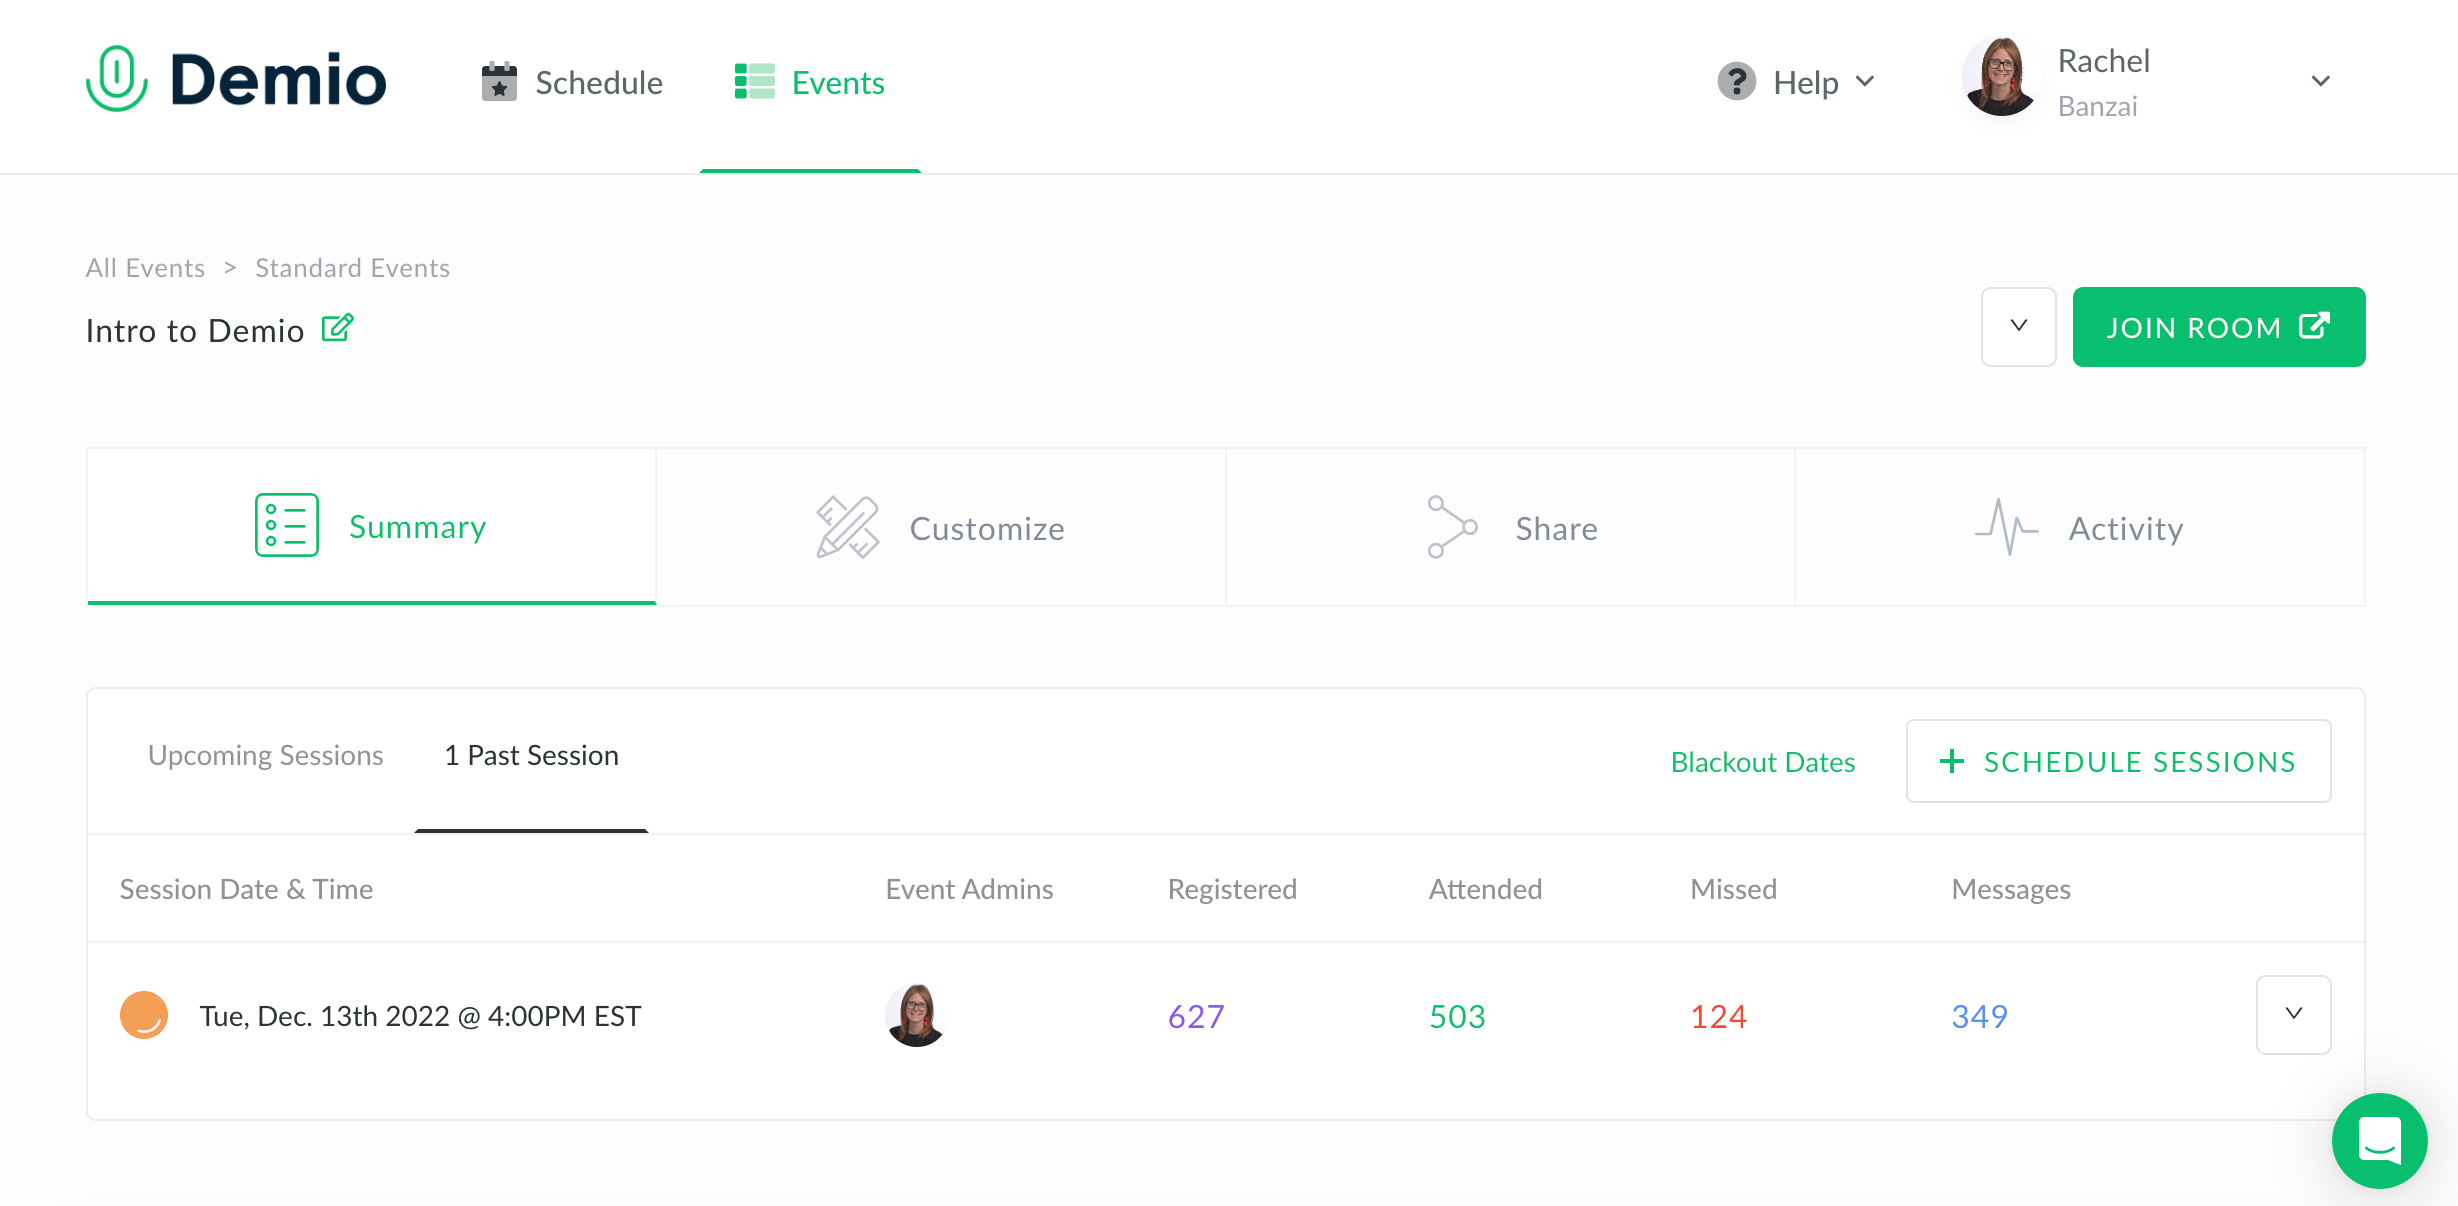
Measuring engagement is easy with the right virtual events solution. These platforms possess robust engagement features as well as built-in analytics for evaluating success.
They’ll track the number of attendees who interact with any included engagement features, revealing who was engaged, when, and for how long.
For example, Demio boasts several engagement features like:
- Real-time chat messages
- Tagged questions
- Q&A sessions
- Emoji responses
- Downloadable resources
- Polls and surveys
- Featured actions
Implement and moderate the above elements to support good event management. Each action an attendee takes involves them more actively in your session.
Demio also offers webinar analytics that automatically tracks engagement via:
- Live Q&A participation
- Survey and poll responses
- Total registrants over time
- Who attended and who missed the event
- Focus time
- Handout downloads
- Featured actions
- Details on individual attendee participation
You can also integrate these into select marketing automation and CRM software.
Content Consumption
Attendees receive ample amounts of content before, during, and after a virtual event.
Pre-event content such as emails can be tracked with integrated email marketing tools. This shows you open rates and other relevant metrics. Demio provides visual analytics for content consumption for easy understanding.
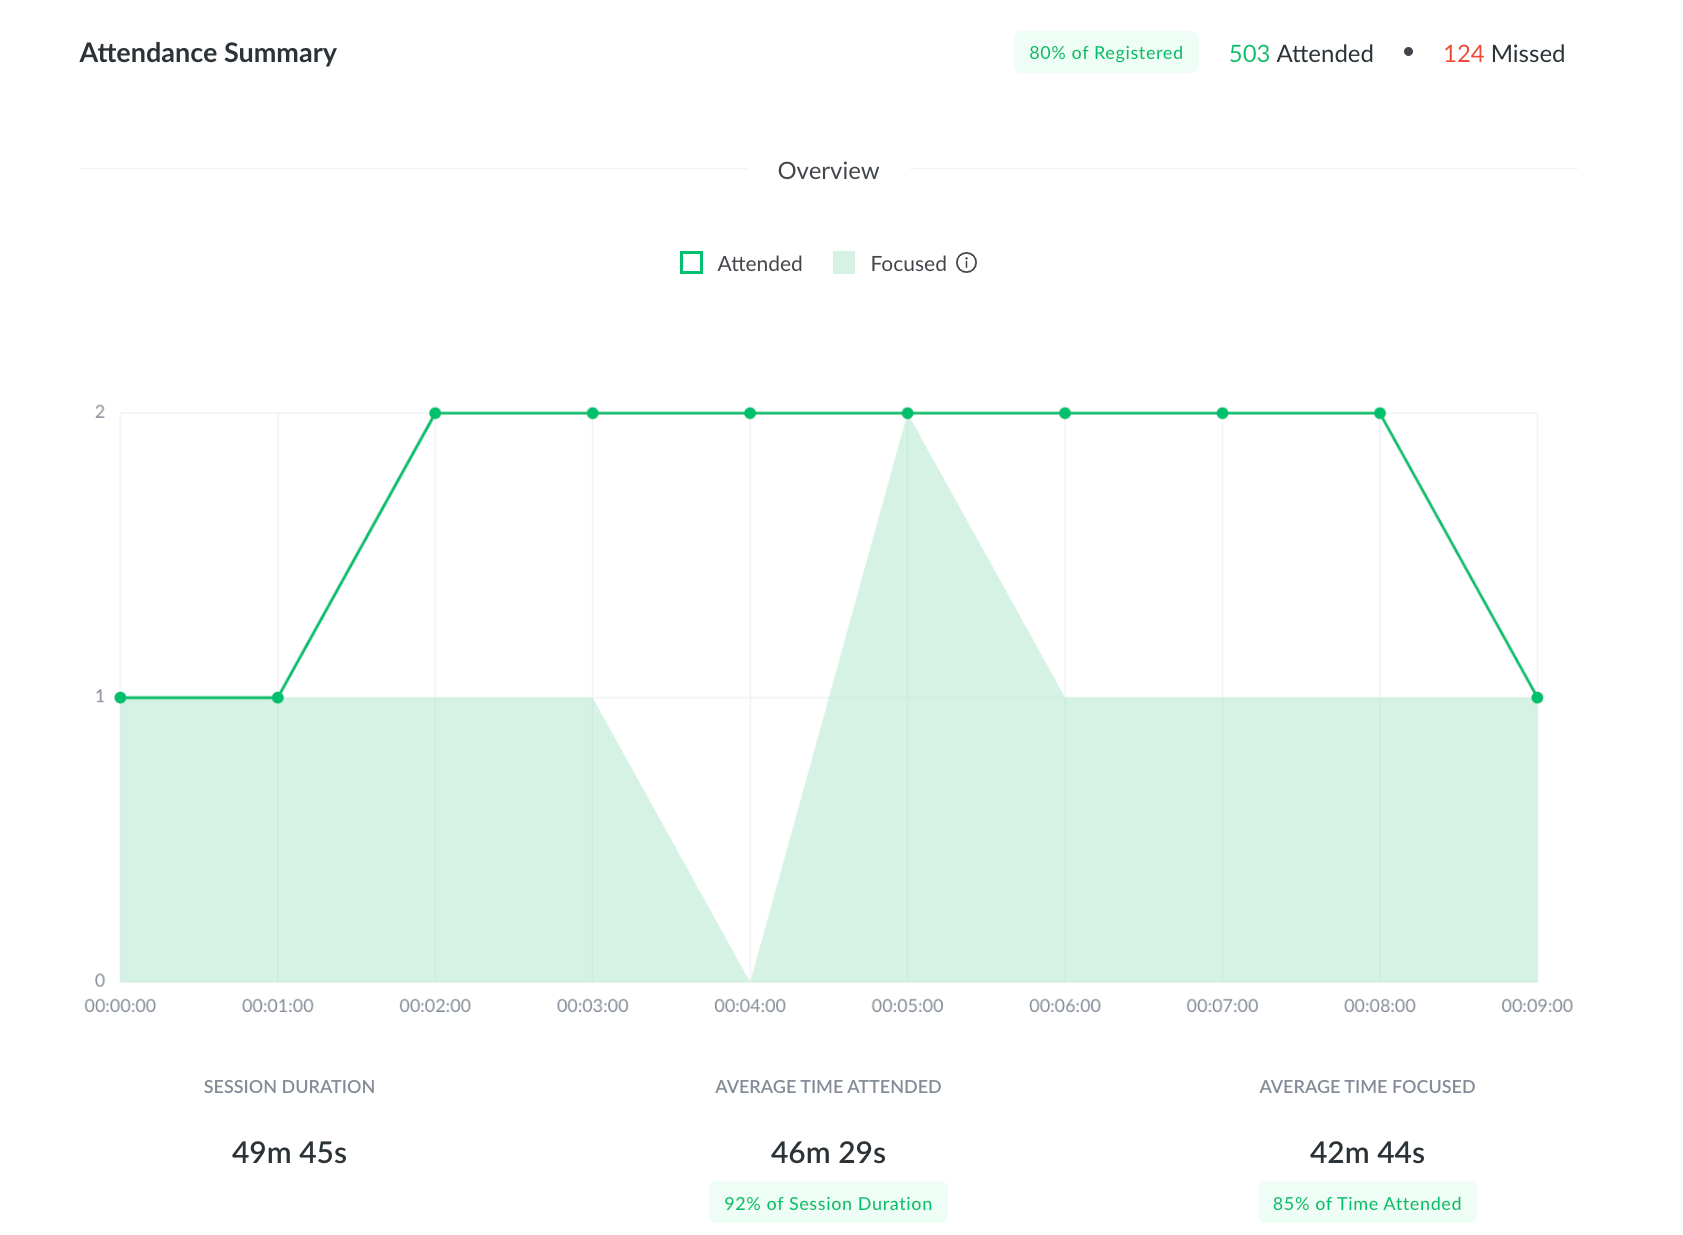
During the event, you need to understand two very important virtual event success metrics: average viewing time and number of returning viewers.
Average Viewing Time
Average viewing time (AVT) is one of the most important pieces of event data. Its formula is as follows:
Average Viewing Time = (Total Viewing Time)/(Total Number of Viewers)
This metric reveals the average amount of time each attendee spent in your event. Virtual events with low average viewing times may not offer enough value to audience members or may not be engaging enough.
Relatedly, virtual event platforms also normally track drop-off points so you can see when attendees left your event. That enables you to pinpoint what triggered their exit and refine your presentation to fix it.
Returning Viewers
Returning viewers is both a lead quality metric for virtual events and a gauge for overall engagement.
Engaging, valuable sessions attract potential customers. When you pull in high-quality leads, you’ll have more chances to secure conversions and returning viewers.
Lead Generation
Lead generation is an event success metric that tracks your ability to:
- Draw new leads into your funnel
- Capture highly qualified leads
New Leads
New leads are recent contacts who have the potential to become customers. They’re acquired through many inbound marketing efforts. In the virtual event space, new leads take the form of registrants and attendees.Registering for your event doesn’t guarantee someone will buy your products or services. But you should still add them to your email list (which you should also segment by lead quality). That way, you address all leads appropriately according to their demonstrated level of interest. It also avoids wasting time passing on unqualified prospects to sales.
Lead Quality
Lead quality refers to the portion of your leads that are qualified versus unqualified. The former are individual attendees or business clients who demonstrate a high level of interest in your brand. They meet certain criteria that make them more likely to convert and so are ready to be passed on to your sales team.

Social Media and Online Activity
Social media is an excellent platform to promote your event and interact with audiences. Common tactics include a mix of sneak peaks, promotional content, ads, and other posts. Social media is also an asset during event follow-up.
You need to track social media activity to understand how your social media marketing is affecting your followers. Specifically, look at mentions of your events and engagement with followers.
Social Media Metrics
As you deploy your social media strategy, you should monitor the following quantitative metrics:
- Likes
- Comments
- Shares
- Tags
- Follower count
- Event hashtag usage
- Resplies (i.e., content published in response to yours)
These metrics offer insight into the engagement your brand garners on social media. In general, aim to expand your social media presence slowly. This way, you gradually grow in brand awareness in a more authentic manner as opposed to coming across as salesy or overly promotional.
Sentiment analysis is another important social media measurement for virtual events. This channel can be great for lead generation, but if the general sentiment is negative, it’s a sign something needs to change. A poor social media image often stems from a mix of:
- Poor audience targeting
- Lack of relevant content
- Poor delivery/boring content
- Ineffective messaging that comes off as click bait
- Poor audio and visual quality
- Too much information
- Unlikeable speakers
- Unexpected deviations from previous content
- Offensive language
People may have other reasons for reacting negatively on your social media pages and posts, so dig deep to uncover the heart of the issue.

Online Community Activity
Another metric that’s both qualitative and quantitative, this looks at the activity related to your brand on forums, whether third-party or run by your company.
If your business hosts forums, measure overall activity during them and pay attention to negative comments about products, services, or the brand itself. Even with a solid product lineup and great customer service, you can usually find imperfections to address in your virtual events.
Networking Opportunities
When properly structured, networking opportunities offer more value for virtual event attendees.
Number of Connections Made
This simple count is the foremost networking metric to nurture and maximize. It’s the sum of attendee interactions, including:
- Direct messages
- Networking interactions initiated
- Chat discussions
- Meetings initiated/scheduled through the platform
- Audience feedback (using surveys and follow-up emails)
Business Deals and Partnerships
You can track this metric through survey results as well. You’ll need to monitor the connections made beyond the event’s conclusion to gain an accurate view.
Post-event Surveys
Post-event surveys are a ripe opportunity to acquire raw data from your audience. Disperse them immediately after the event ends for the most honest responses.
Additionally, use scores to collect participant feedback (e.g., see how your event attendees rate the experience on a scale of 1 to 10). Pay special attention to the net promoter score.
Net Promoter Score (NPS)
NPS estimates what portion of your audience will be satisfied and loyal to your brand, possibly even promoting it in the future.
Audience members are divided into three categories:
- Promoters: Mostly or fully satisfied
- Detractors: Mostly or fully unsatisfied
- Passives: Plain satisfied, without strong opinions either way
To calculate your NPS, ask your audience “On a scale of 1 to 10, how likely are you to recommend our product/service to a friend or colleague?”
- Those who respond between 1 and 5 are detractors.
- Those who respond between 6 and 8 are passives.
- Those who respond either 9 or 10 are promoters.
Once you’ve delineated each group, divide each one by your total number of responders and multiply that quotient by 100 to find their respective percentages. Then, insert the appropriate variables into the NPS formula:
NPS = (% Promoters) − (% Detractors)
This will produce a score ranging from −100 to 100. Obviously, the higher, the better.
NPS returns the clearest evaluation of stated audience feedback for virtual events.
Technical Metrics
Even if everything is planned well, technical problems can crop up and harm the success of your online event. Often, the causes aren’t immediately obvious to event planners, speakers, or moderators. For recorded events, on-demand webinar platforms can make managing these factors easier, provided you captured the recording correctly first.
This is why it’s important to track a host of technical metrics like:
- Uptime/downtime
- Latency/packet loss
- Video streaming quality (frame rate)
- User access
- Engagement metrics (to identify potential technical issues)
The most important of these is uptime. Demio’s webinar platform tracks uptime and guarantees support if anything goes wrong, with a response time of less than two minutes.

Revenue and ROI
Although the previous metrics are important, revenue and ROI are the ultimate measurements of success.
Revenue Generated
The revenue each event produces is easy to total. Track all sources of revenue, including:
- Ticketing
- Sponsorships
- Affiliates and partners
- Product/Service sales
Return on Investment
Virtual event ROI is the difference of your total revenues minus all expenses. So, tally all the costs associated with holding your event and subtract them from the total revenue.
Long-Term Impact
Review as well metrics for actions that point to long-term positive outcomes gained from your sessions.
Post-event Content Consumption
Virtual event follow-up normally includes consumable content that you can easily track, like downloadable resources.
Follow metrics such as:
- Email open rates
- Subscriptions
- Registrations
- Social media shares
- Content downloads
- Lead generation
- Retention rate
Follow-Up Conversions
Conversions that result from any post-event emails and other follow-up communications are crucial to monitor. This is the last major conversion action, as only 2%–5% of attendees convert immediately after a virtual event.
Comparative Analysis
After defining your success metrics and collecting data from similar events, you can begin your comparative analysis.
Analyze the results obtained from your previous events to compare the performance of different formats, times, topics, and more. Set new benchmarks for future events so you can methodically improve your results.
You can perform comparative analysis with Demio’s built-in analytics features by following these steps:
- Log in to Demio, Bluejeans and alternative solutions
- Select the events you want to review
- Choose the success metrics to compare across different events
- Review the success metrics one by one
- Compare your results against previous results
- Compare your results against industry benchmarks
- Identify the tactics that produced your best results
- Use the insights learned to make data-driven decisions
Lay the Foundation for High-Yielding Virtual Events by Tracking Success Metrics
Virtual event success metrics are the key to improving their results over time. Monitor the ones we’ve outlined in this article to obtain a comprehensive overview of your events’ performance and pinpoint where you can fine-tune your efforts for a stellar attendee experience.
To make the process easier, start by choosing the right virtual event platform. Most metrics are built into high-quality virtual event software and help you run comparative analyses. From there, you can set higher benchmarks for future events — and smash them.
Book a demo today and learn how Demio can help you maximize virtual event success metrics.
Frequently Asked Questions About Virtual Event Success Metrics
How do you measure engagement in a virtual event?
Virtual event engagement is measured by actions the attendee takes and the time they spend viewing. These include poll and survey responses, chat statistics, average viewing time, and other metrics that the software measures.
What makes an online event successful?
High lead generation and profits are the markers of a successful event. To boost those metrics, you need a complete view of how people enter your funnel and the experiences they go through that determine whether or not they convert.
What are the four key performance indicators?
Key performance indicators can be broken down into four basic categories. These categories include engagement and satisfaction metrics, audio/visual quality, financial metrics, and sales metrics.
Related Articles
%20(1).webp)